
How to Create a Family Tree in Microsoft PowerPoint

A family tree is a hierarchical chart that details the connection between members of a family. You can create your own family tree in PowerPoint by using one of Microsoft’s many hierarchy style SmartArt graphics. Here’s how.
To get started, open PowerPoint and navigate to the “Insert” tab.
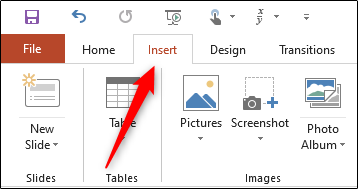
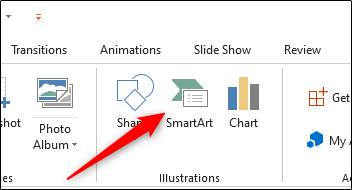
In the “Illustrations” group, click “SmartArt.”
The “Choose a SmartArt Graphic” window will appear. In the left-hand pane, click the “Hierarchy” tab.
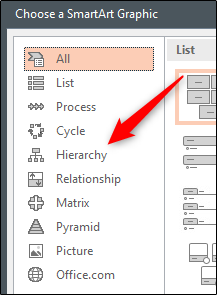
You’ll now see a small collection of hierarchy SmartArt graphics. For standard family trees, the “Organizational Chart” option is ideal. However, you can choose whichever SmartArt graphic works best for you.
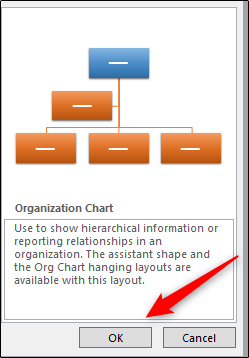
Select the chart you would like to use by clicking it.

Once selected, a preview and a description of the chart will appear in the right-hand pane. Click “OK” to insert the chart.
With the chart added to your presentation, you can start entering the names of the family members in each respective box. Do this by clicking the box and typing their name. The text will resize itself to fit the boxes automatically.

You can delete boxes you don’t need by clicking the box to select it and then pressing the “Delete” key on your keyboard.
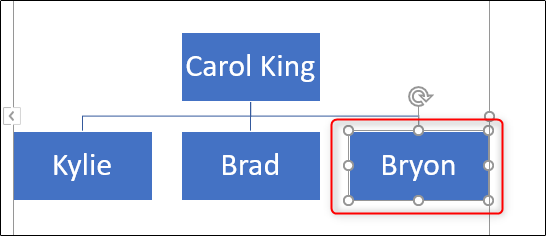
You can also add additional boxes below or above certain positions. To do this, highlight the box by clicking it.
Next, click the “Design” tab in the “SmartArt Tools” group.
In the “Create Graphic” group, click the arrow next to the “Add Shape” option.
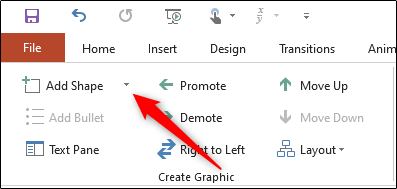
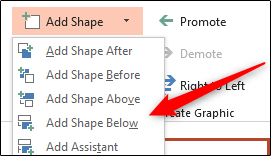
A drop-down menu will appear. The option you select from the menu will depend on where you want to place the box with respect to the currently selected box. Here’s what each option does:
- Add Shape After: Adds a box to the right, and on the same level, of the selected box.
- Add Shape Before: Adds a box to the left, and on the same level, of the selected box.
- Add Shape Above: Adds a box above the selected box.
- Add Shape Below: Adds a box below the selected box.
- Add Assistant: Adds a box between the level of the selected box and the level below.
In this example, assuming our fictional character Bryon had a child, we’d use the “Add Shape Below” option.
A box will now appear below our selected box.
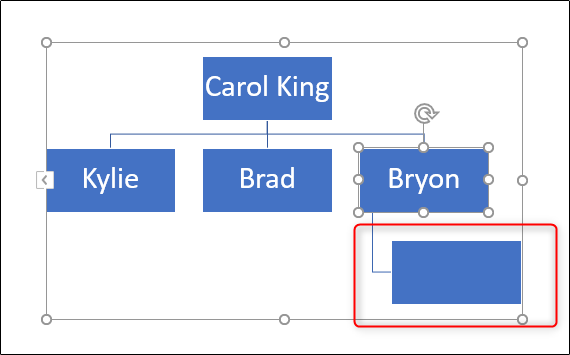
Once the box is placed, enter the name of the respective family member. Repeat these steps until your family tree is complete.
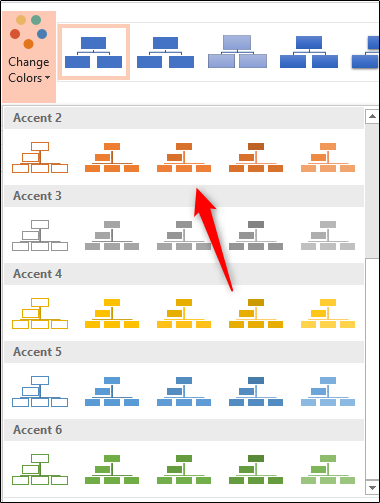
You can also tweak the design or change the color of the chart. Click the chart to select it and then click the “Design” tab. In the “SmartArt Styles” group, you’ll see a range of different styles to choose from, as well as the option to change colors.
Click the “Change Colors” option to show a drop-down menu, then select the color scheme you like best.
Next, choose a style you like from the lineup in the “SmartArt Styles” group. We’ll use the “Inset” option.

Your chart will take on the selected color and style.
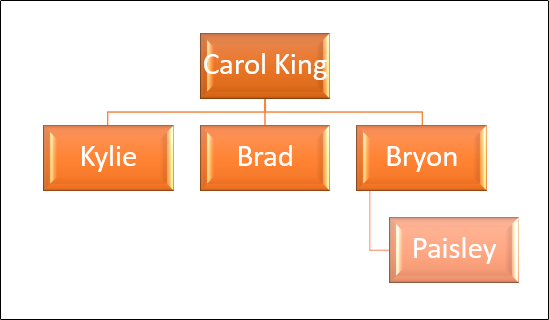
Play around with the styles and colors until you find one the works best for you.
Related : How to Rename a Data Series in Microsoft Excel
Creating a family tree is an exciting thing, but it’s always a collaborative effort. You can ask family members to collaborate on the presentation with you to ensure that no family members are left out. And remember to share the presentation with your family once the family tree is complete!


Leave a reply